英國央行金融穩定主管Andrew Haldane警告,如果“歷史上最大規模的債券泡沫”破裂,那麼全球金融穩定都將面臨巨大風險。
據英國衛報,在就目前金融狀況向英國議員作證時,Andrew Haldane承認,英國央行金融政策委員會用了太長的時間來要求銀行提升資本,並對在現任央行行長金默文治理下的英國央行風氣氛圍做出了批評。
Andrew Haldane還表示,“由全球央行製造出的債券泡沫破裂,是我現在就能夠劇烈感受到的一大風險。”
“如果要我選出一個目前對全球金融穩定最大的威脅,我想應該是全球政府債券收益率最近幾週內的混亂逆轉。”
“說得更明白一點,我們自己人為地製造了歷史上最大的政府債券泡沫。如果這個泡沫不能夠按照我們預期的那樣發展,我們需要警惕其可能產生的後果。”
此外,Andrew Haldane還表示,因為購買抵押債券的擔保計劃,可能會導致一定程度的泡沫,目前金融政策委員會正處於對這些泡沫的警惕中。他還強調,這些計劃應該是暫時性的。 “以美國為例,房利美和房地美的存在曾經都只是暫時性的計劃,然而75年之後,這個計劃依然沒能結束,從而造成了全球經濟的大地震。”
Andrew Haldane 還說,“如果英國央行點燃了下一次金融危機的導火線,肯定與政治上的干預脫不了乾系。”
 六月飛霜,是否足以形容今年六月的股市?可能不,或要用「六月雪」才足以點出今年六月股市的「傷」。
為甚麼今年或會是較霜更「傷」的雪?
原因是節前國內銀行利息全面抽高,昨日《經濟日報》我也談過這個,今天再談。近日國內銀行息抽幾高?
按六月七日上午11時30分計,上海銀行同業拆息(SHIBOR):
短息高於較長期息,是息口市場驚恐(Panic)的表現,上周有商業銀行交易員表示:「市場已瘋了,大家只借錢,不講價。」
一如昨文所述,近日銀行間資金面緊繃,是由一系列疊加因素造成,這包括:1. 準備金補徵;2. 外匯佔款下降(再不可以同一批貨,團團轉做假出口逾50次,圖穀高外匯佔款額);3. 債市監管升級;4. 端午節前資金備付。
一
直以來,中國出口一直有水份,因為有出口退稅,個別不法商、廠會用虛假出口文件來呃阿爺的出口退稅。近月有個別不法銀行亦加入這行列,不法商、廠除用假出
口呃出口退稅外,尚利用這些假出口文件和假貨款單「創造」外匯收入,然後將外匯賣給銀行(即人行阿爺),並將所得到的人民幣,存入配合的銀行去買「理財產
品」,一旦資產價格爆破,如果買入這些理財產品的資金,就是由假出口、假貨款單而來,則受到損失的,會是相關的銀行,或者是阿爺,因為當這個骨牌爆破的損
害是大到不能爆時,就算是一直講自由市場,商家負責自己破產的美國政府,也要用納稅人的錢,去援助大到不能倒的金融企業。
筆者這個推演,是否杞人憂天,危言聳聽?且看三件事:
1. 去年九月,當時為中國銀行行長,現為證監會主席的肖鋼,在英文《中國日報》謂有些理財產品是「龐氏騙局」。
2. 高盛於月前沽清手上的內銀股,這可以是高盛自己缺水,不能不沽貨,但亦可以是高盛不想蝕水。
3. 外資大行近月一直唱空內銀股,你可以講他們是搞陰謀,不懷好意,但如果他們唱空原因有三分真,震盪也可不小。
不少人擔心地方債務會拖垮內銀,對此,筆者一直是不太擔心的,
使筆者對內銀擔心的,不是這些表內借貸,銀監一直在看緊有關數據,但表外借貸就不那麼一回事,是一直無王管,而且愈來愈猖獗,達到真的「龐氏騙局」,這些「騙局」以後有機會再談,今只看兩個通知大家就知事態的嚴重性。
1. 2002年12月31日,四部委聯合發布《關於制止地方政府違法違規融資行為的通知》,反證違法、違規融資嚴重。
2.
2013年3月28日,銀監會「8號文」:《銀監會關於規範商業銀行理財業投資運作有關問起的通知》,簡單講是限制非標準化債務的發行,亦即制止可能的騙
局再出台,只可惜這個通知是容許,這些涉嫌犯規銀行有大半年時間去「執正」,只要銀行到2013年12月底執正便成,一方面這是給犯規者個更新機會,但另
方面亦可以是讓犯法者持續犯法,只要這大半年內刮得足夠退休金,12月30日辭職,留下「蘇州屎」又如何?習近平謂要嚴反貪腐,不然會亡黨亡國,著實不
假。
在這個12月31日之前,還有個6月30日,就是外匯管理局因應上文所述的虛假出口與虛假收款單,而所搞出來的欺詐式外匯佔款問題,外管局要求商業銀行根據外匯貸存比,補充外匯頭寸,限期為6月底,這舉指就是謂,你話這批貨款真嘛!即是有真錢啦!自己搞掂。
古時有刑不上大夫,今時就外?不上中央,以免難查,迫你自己食自己,一做之下,五月的出口相對於三、四月就立跌,收貨款少了,外?佔款也就少了,估計這部分的頭寸會收縮銀行間資金的2,000億,而影響會在今年六月中最明顯。
傳
統的端午節後倒淡,加上六月底外?佔款要撥正,再加上到今年底時銀行理財產品要均真,種種都會使到國內資金供應趨緊,如果阿爺不瞌埋眼放水,而是要認真處
理國內金融界不正之風時,相信A股市場之後會是六月飛霜兼加六月雪。但正當的投資者倒不用擔心,有謂瑞雪半年,大雪殺死害蟲,之後的收成反可豐盛,總之坐
定定,?錢最老定,唔定就畀壞人fling。
There still seems to be huge misunderstanding by many investors as to
what it really cost to mine silver. I still come across individuals
and analysts who believe the price of silver is overvalued because it is
so cheap to mine the metal. Part of the reason for this FALLACY, especially from bearish silver analysts, is due to the reporting of CASH COSTS.
It doesn’t matter which mining company report you look at, just about
all of them list what their cash cost is to produce their main metal.
Furthermore, the Silver Institute lists the primary silver miner’s cash
cost per ounce from the Annual World Silver Survey on its website for
all to see.
According to the Silver Institute:
Primary silver mine supply grew by 1 percent to
account for 28 percent of global silver mine output. Mexico was the
world’s largest silver producing country in 2012, followed by China,
Peru, Australia and Russia. Primary silver mine cash costs rose to $8.88 an ounce, reflecting higher prices for labor, electricity, and maintenance charges.
So, it seems as if the primary miners produced silver at $8.88 cash
cost an ounce in 2012. This was up over 2011. Here are the cash cost
figures for the past 3 years (World Silver Survey’s, Silver Institute & Kitco):
2010 = $5.47 (avg. spot price = $20.19)
2011 = $8.11 (avg. spot price = $35.12
2012 = $8.88 (avg. spot price = $31.15)
With low cash costs such as these, the silver miners should be raking in the dough and stating huge profits. However,
a percentage of these primary silver miners are actually stating net
income loses even at realized prices of $28-30 an ounce.
When the World Silver Survey calculates the primary silver miner’s
cash cost, they only use a sample portion. Let’s just say, this sample
size is less than two-thirds of the silver produced from the primary
miners. Even though the folks (GFMS, Reuters) who publish the World
Silver Survey do a good job calculating the cash cost for the primary
silver mining industry, we will find out how useless it can be in
determining the profitability of a mining company.
Excellon Resources Very Low Cash Cost & Net Income Loss??
I selected Excellon Resources as they are a perfect example to show
how a company can state a very low silver cash cost while reporting a
net income loss. Now, I am not singling out Excellon or putting out
negative information about the company, rather Excellon is actually a
pretty good company that has the highest grade silver mine in Mexico.
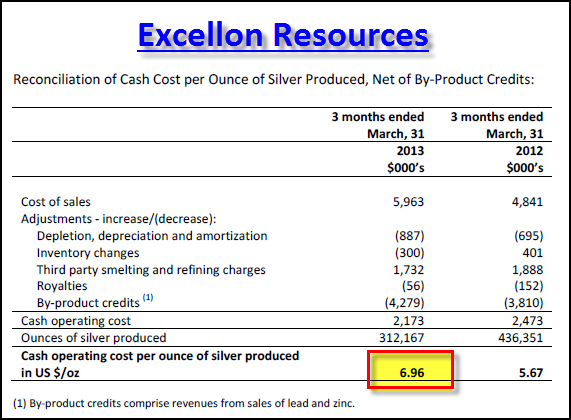
Let’s take a look at Excellon Resource’s Q1 2013 report on their cash cost:
According to Excellon, they produced silver at a cash cost of $6.96
an ounce in Q1 2013, up from $5.67 in the same period in 2012. As you
can see they took their cost of sales ($5,963,000) and
then added back Depletion, depreciation, amortization, inventory changes
and by-product credits. Thus, they had a cash operating cost of only $2,173,000 which was divided by silver ounces produced (312,167 oz) to get their $6.96 cash cost.
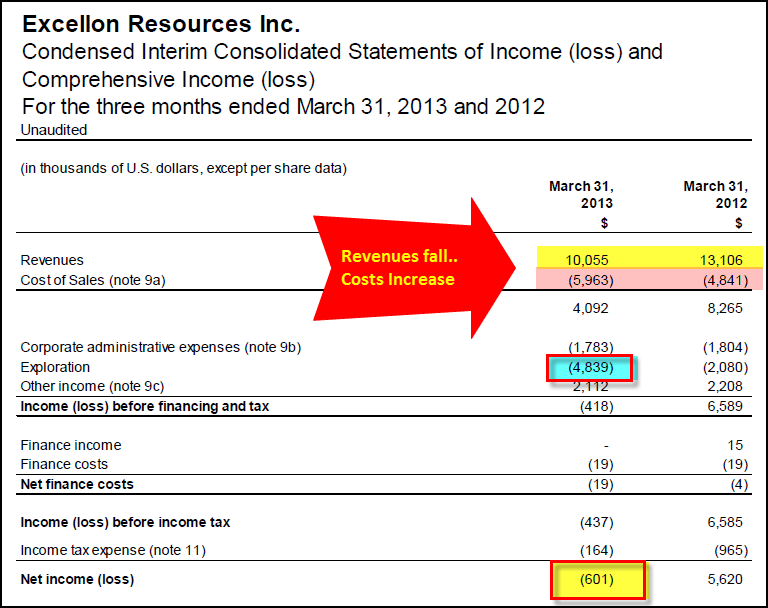
With this sort of low cash cost structure, Excellon should be making
excellent profits. However, if we look at their Financial Statement for
Q1 2013 we have the following:
Even, with such a low cash cost of $6.96 an ounce, Excellon stated a $601,000 net income loss for Q1, 2013 compared
to a $5.6 million net gain in previous period. If we went by
Excellon’s change in cash cost year over year, this would be the result:
CASH COST Change: $6.96 – $5.67 = +$1.29 oz
Something seems fishy. How could Excellon’s cash cost increase only
$1.29, but their net income decline more than $6 million year over year?
First… we will notice, that revenues on the top of
the table declined more than $3 million. That alone wipes off $3
million from their bottom line.
Second…. their Cost of Sales increased from $4.8
million to $5.9 million, year over year. So, that knocks off another
$1+ million of net income.
Third… if we look at their exploration cost (in
blue), we will see that it increased nearly $2.8 million compared to the
same quarter last year. That erases at least another $2.5 million from
their bottom line.
Without those three factors, Excellon would have shown a positive
$6.5 million net income gain instead of a loss. As you can see,
Excellon’s cash cost of $6.96 does not provide the investor a clue to
the profitability of the company.
The Cash Cost Disclaimer
Anytime a company reports their cash cost in their financial reports
they include the following explanation (I label it as a cash cost
disclaimer) of their cash cost. This one is from Excellon’s Q1 2013 MD
& A Report:
Cash operating cost, net of by-product credits, is provided as additional information as is non-IFRS measure that does not have a standardized meaning.
This measure should not be considered in isolation or as a substitute
for measures of performance prepared in accordance with generally
accepted accounting principles and is not necessarily indicative of operating expenses as determined under generally accepted accounting principles.
IFRS stands for International Financial Reporting Standards and GAAP
is the generally accepting accounting principles. Basically, cash costs
are not indicative of operating expenses and are not in accordance with
either the IFRS & GAAP.
What Caused Excellon to Lose Revenues & Profits?
So now that we know Cash Costs are bogus in determining the
profitability of a company, let’s look at what happened to Excellon’s
balance sheet.
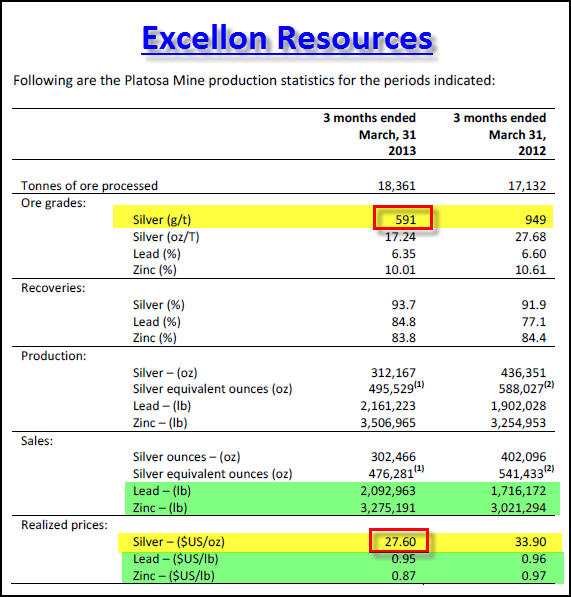
If you look at the table below there are TWO BIG Culprits that
destroyed Excellon’s profitability compared to the same quarter a year
ago.
The first big problem was the decline in silver grade year over
year. At the top of the table you can see that the average ore grade
in Q1 2013 was 591 g/t (grams/tonne) compared to 949 g/t, Q1 2012. Not
only did Excellon suffer a 38% decline in grade, the also processed an
addition 1,250 tonnes of ore. Here we can see that Excellon had higher
costs to produce 125,000 less ounces of silver.
The next big hit came from their $6.30 decline in the price of silver
they received shown at the bottom of the table. I highlighted the
green areas to show the zinc and lead by-product data. We can see that
zinc and lead were not part of the problem in profitability as the price
of lead was the same while zinc fell half of what silver did.
Furthermore, both lead and zinc had higher production and sales. The
practice of mining companies subtracting their by-product credits from
their silver mining costs to show a LOW CASH COST obfuscates the TRUE
BOTTOM LINE PICTURE.
What was Excellon’s Estimated Silver Break-Even Price
There are several ways to get to a pretty good estimated break-even
price for a silver miner. You have to use either Net Income or
Adjusted income and divide it by the Silver ounce sold during the
quarter. Then you add or subtract that figure to their Realized Price
that quarter.
-$601,000 / 302,466 = -$1.99
$27.60 + $1.99 = $29.59 Net Income Break-Even
So, we can see that Excellon needed $29.59 an ounce silver to break
even that quarter. This is a very simple and easy way to get an
estimated break-even, however there are other more detailed methods
which will be discussed in future posts.
Total costs to mine silver are much higher than the industry is
putting out in their financial statements. With the current low price
of silver below $22, the majority of primary silver producers are losing
a great deal of money. According to my calculations of my top 12
silver miners only ONE is making a little money.
Even though the mining stocks have declined substantially over the
past few years, once the broader stock markets collapse, money will be
forced to move into hold physical assets to protect their wealth. The
mining stocks may turn out to be some of the best assets to own in the
next several years.
http://srsroccoreport.com
每個人都有翻開歷史新頁的一天。對Peter Schiff而言,這天尚未到來。
今年,「黃金當然可以上漲到1700或1800美元。但我認為,最終黃金還會進一步大幅走高,」Schiff告訴CNBC電視台說。
其實,這位黃金多頭不只仍看漲,他還極度看漲。
「當世界了解我們現在所處的水平,黃金將會漲翻天,」歐元太平資本公司執行長Schiff說。
Schiff相信,聯準會(Fed)持續的貨幣寬鬆政策,將導致通貨膨脹,推升黃金走高。那麼,Fed將縮減購債計劃的傳言,是否讓他感到擔憂?
一點也不。
「Fed沒有退場策略,」Schiff說。「這只是空談。沒有縮減計劃,因為縮減購債會搞垮經濟,銀行業,還有美國政府。」
他補充說,「Fed可能會進一步推出量化寬鬆(QE),他們將必須印更多鈔票,買更多公債,阻止市場崩跌,這對黃金極屬利多。」
那麼,短期看法如何?Schiff承認,黃金走勢並不佳,但他相信黃金是在打底。
「的確有許多投機客軋平技術性黃金倉位。有許多技術性賣壓,黃金市場的氣氛非常利空,投資人因而趁漲勢賣出,」Schiff說。「但底部就是因此出現。」
一旦黃金築底完成,高點就在天上了。
「當黃金市場反轉,就會劇烈,」Schiff說。「我認為黃金將會上漲,而且速度會比下跌還快。」