 A Perfect Storm is brewing in the physical silver market…
From the SRSRocco Report:
As global financial and economic systems continue to disintegrate, this will put more stress on the silver market. Why? Because elevated physical silver investment demand will likely exceed available silver supply in the future. Even though physical silver investment demand has fallen off since the huge spike starting in June, market conditions have impacted supply in a negative way.
According to the most recently released data, three of the top five silver producing countries are showing large declines in production compared to the same period last year. When I researched the mine supply figures, I came up with some conflicting data. For some strange reason, my data showed a decline in Mexican silver production, while figures from another source stated an increase.
I wrote the organization responsible for providing silver production figures to the Chile Copper Commission. You see, the Chile Copper Commission (Cochilco.cl) provides global production data on many metals. They use data from World Metal Statistics.
Here is a snapshot of their monthly world silver production update:
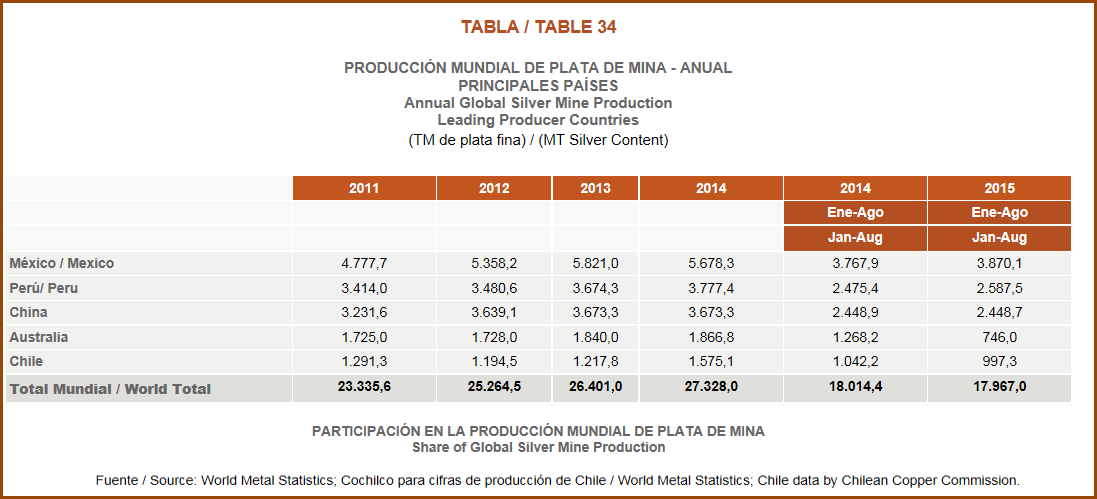
Please click on the table to see a larger image. If you look at Mexico silver production, they show an increase to 3,870.1 metric tons (mt) JAN-AUG 2015 up from 3,767.9 mt during the same period in 2014. From this report, Mexico’s silver production JAN-AUG 2015 increased 102 mt, or 3% year over year (yoy).
However, I spoke with a person at Mexico’s Department of Mineral Resources (INEGI), and they sent me the link to their monthly silver production figures. I downloaded the excel spreadsheet and made a screenshot show below:
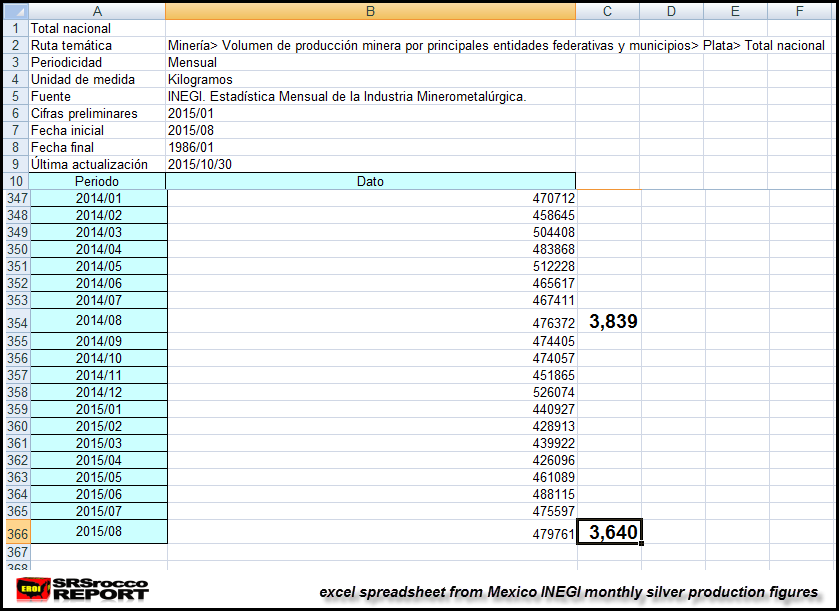
I added the total of Mexican silver production from JAN-AUG 2014 and 2015 and put the figures in the next column. As you can see from Mexico’s official INEGI monthly data, silver production is down from 3,839 mt in JAN-AUG 2014 to 3,640 mt during the same period this year.
So, instead of Mexican silver production being up 3% this year (according to data from World Metal Statistics), it’s actually down 6% if we go by official Mexico INEGI figures.
When I contacted World Metal Statistics about this inconsistency, they were nice enough to reply. I asked them why was their Mexican silver production showing an increase while Mexico’s official data reports a decline? They stated that they do use INEGI data for their Mexican silver production figures, but they use different data for the Chile Copper Commission.
That being said, they were surprised that Mexico showed a decline in silver production in 2015. I sent them the excel spreadsheet from Mexico’s INEGI, and they told me that their data was different. They replied to me stating that they had to update all their Mexican silver production data back to 2011… I gather their figures were based on incorrect data. How interesting.
I find this quite interesting because it costs an individual 2,240 Euros to purchase 12 monthly metal production reports from World Metal Statistics. Readers on my site get to find out this information for FREE.
While I used some of the silver production data (in the chart below) from the Copper Commission Table shown above, I double checked Peru’s and Australia’s silver production from their official state figures.. and they matched up. That being said, I also have a problem with World Metals Statistics “Total World Silver Production Figures” shown at 17,967 metric tons (mt) JAN-AUG 2015 compared to 18,014 mt during same period in 2014. These figures come from the Chile Copper Commission table above.
Basically, World Metal Statistics shows a small reduction in total global silver supply JAN-AUG 2015 compared to last year. Even if we adjust the revised lower Mexican silver production data, total world silver production is only down 2.5%… again, according to their figures.
However, if we just go by the top five producers (Mexico, Peru, China, Australia & Chile), overall silver production in down 6%. I gather World Metal Statistics is saying the rest of the countries are reporting increases to show just an average loss of 3% worldwide. Unfortunately, some of the other countries such as Canada are reporting declines in silver production.
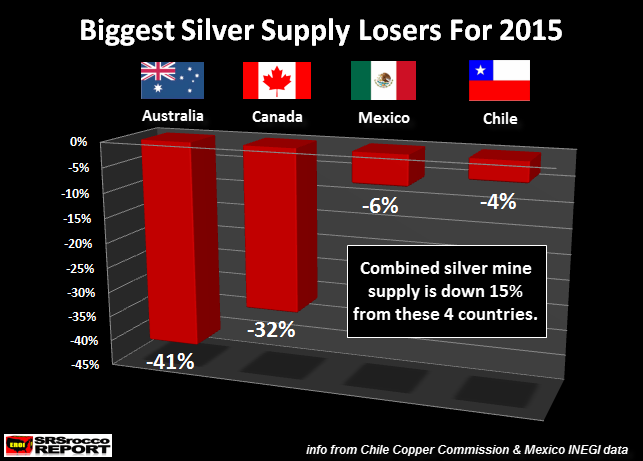
Here are the biggest silver supply losers for 2015:
As we can see from the chart above, Australian silver production JAN-AUG 2015 is down a whopping 41% compared to the same period last year, followed by Canada down 32%, Mexico down 6% and Chile down 4%. The combined silver production from these four countries is down 15% compared to last year.
Here is additional silver production data from three countries:
Russia’s Polymetal Jan-Sep 2015 = +53 mt
Poland’s KGHM Polska Jan-Jun 2015 = + 6 mt
United States Jan-Aug 2015 = -22 mt
If we just add up these three producers, we find a net increase of about 37 metric tons. Of course, these show different periods, but an increase of even 40-50 mt for these producers won’t change the overall decline of the top five down 684 mt JAN-AUG 2015.
I would imagine the low metal prices going forward will continue to impact global silver production. Chile, the largest copper producer in the world, is showing a 4% decline in silver production this year. The majority of silver production from Chile is a by-product of copper mine supply. As the price of copper continues to fall, we will see more companies shut down copper mines. This will have a negative impact on global silver supply going forward.
I will be writing future articles on how the future silver supply, demand and price will impact the market in the next several weeks and months.